


Election Day falls on Tuesday, November 3, 2026. Every one of the 435 voting seats in the House of Representatives is on the ballot, alongside 35 Senate seats, thirty nine governorships across thirty six states and three territories, and thousands of state and local contests.
The Senate contests include 33 regularly scheduled races plus two special elections to fill the remaining terms left vacant when Marco Rubio and JD Vance departed the chamber for the executive branch.
The president is not on the ballot, but a midterm election under a sitting administration functions as a referendum in practice more than in name. Winners are certified over the following weeks, and the 120th Congress convenes in Washington in January 2027.
Table of contents
- The House: A Map Built to Be Close
- The Redistricting War
- The Senate: A Steeper Climb for Democrats
- What History Says About Markets in a Midterm Year
- The Policy Lines That Matter for Portfolios
The House: A Map Built to Be Close
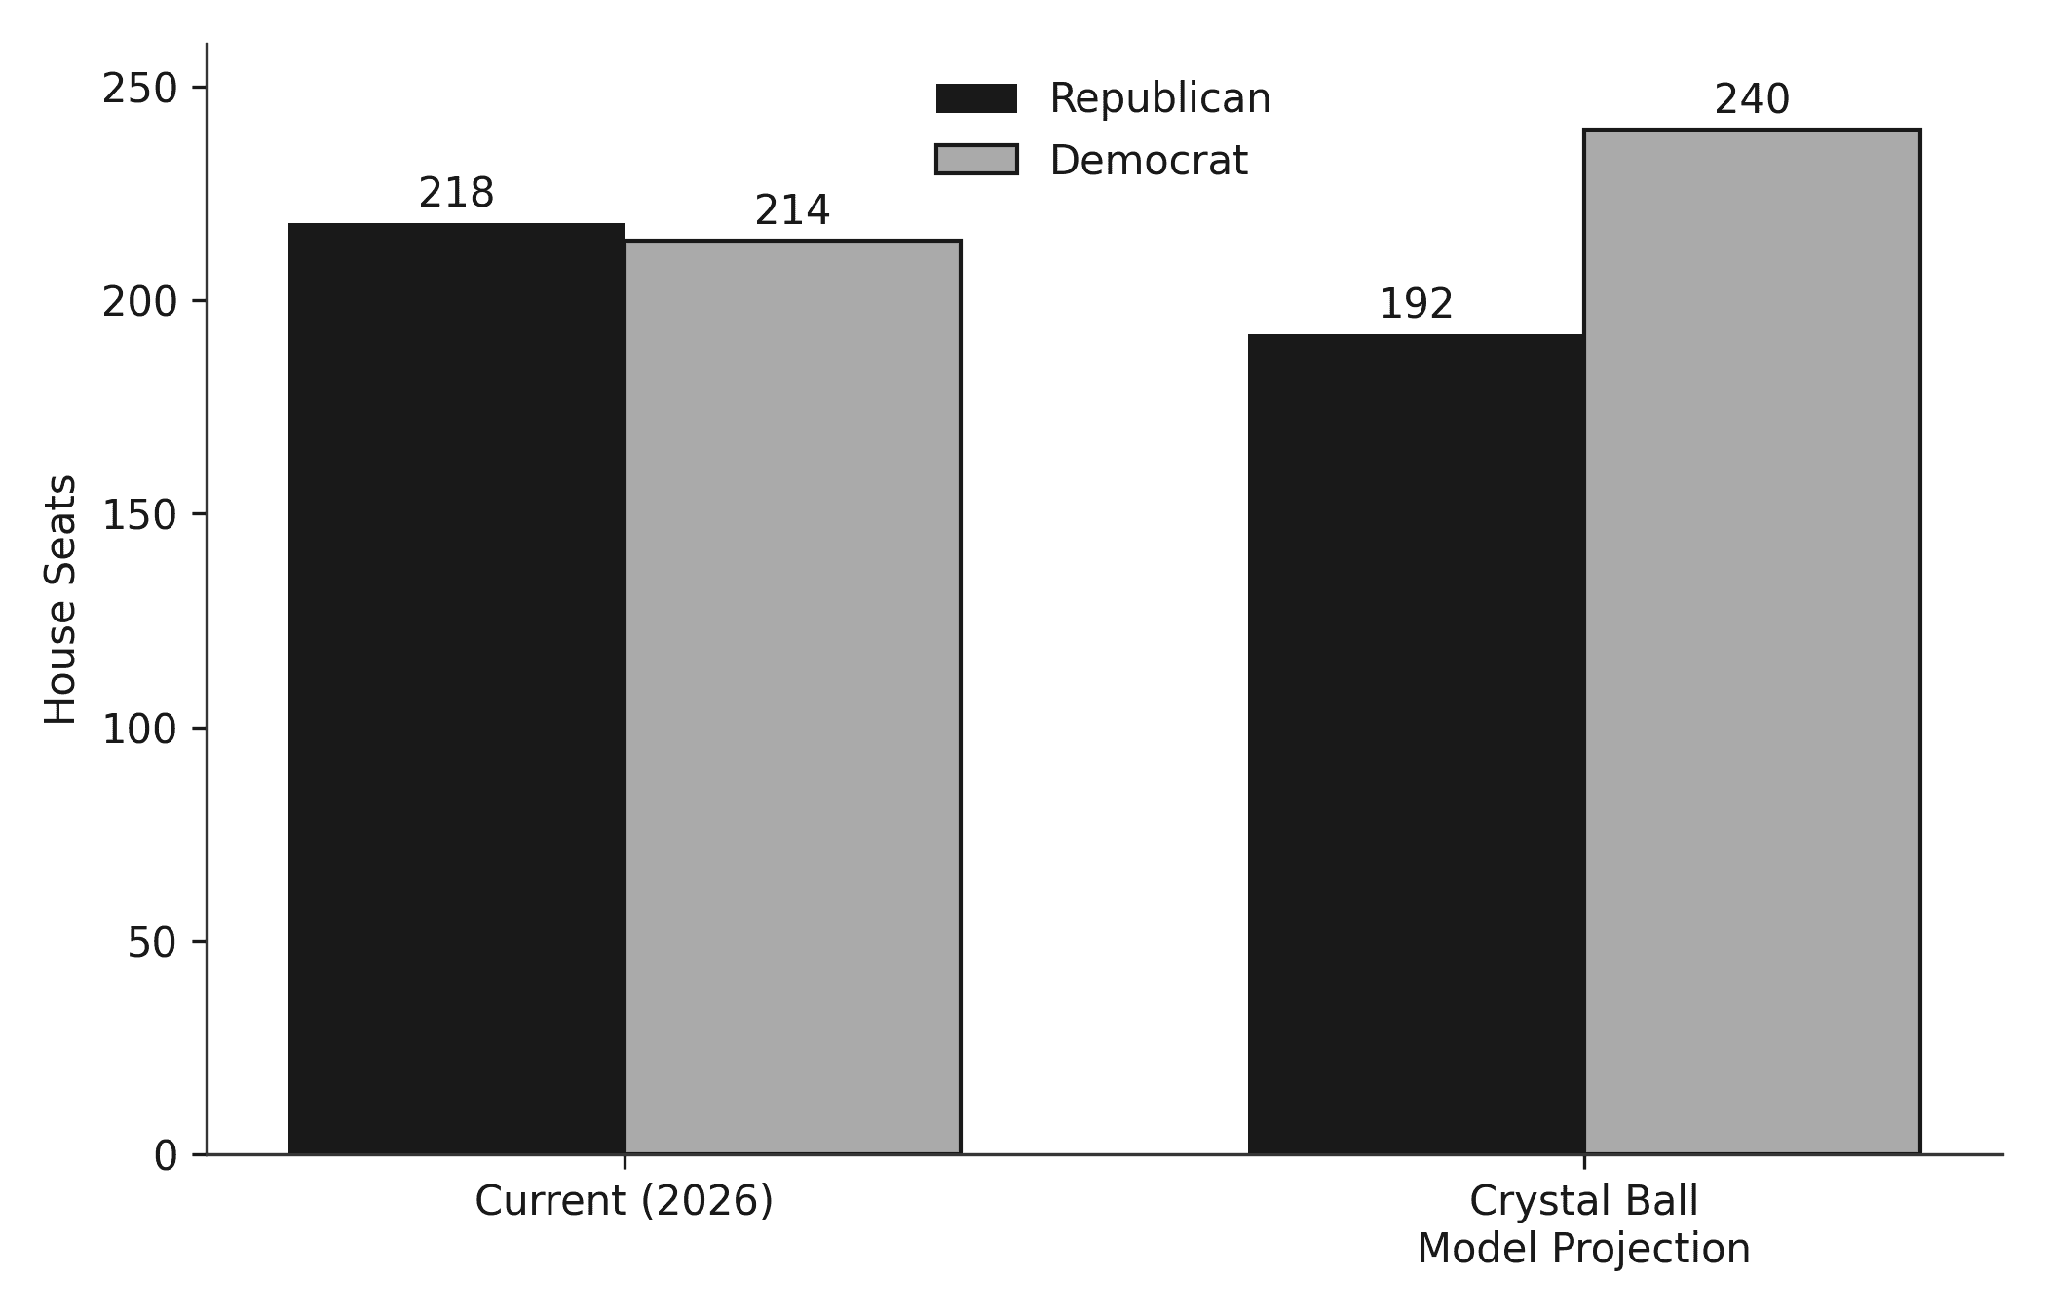
Republicans currently hold the House 218 seats to 214, with three vacancies, meaning the majority threshold of 218 leaves almost no room for slippage.
Generic ballot polling through July has shown Democrats ahead by roughly three and a half to six points depending on the pollster, with an Economist and YouGov survey pointing to a modest Democratic edge and a Fox News poll finding a strong appetite for change among the electorate.
A regression model built by the University of Virginia's Center for Politics, which has historically predicted midterm House outcomes with high accuracy using only two inputs, the president's party seat count and the generic ballot margin, points to a meaningful Republican seat loss this cycle even after crediting Republicans with the redistricting gains described below.
CHART 01
House Seats: Current Split vs. Model Projection
The Redistricting War
Both parties spent 2025 and 2026 redrawing maps outside the normal decennial cycle. Texas passed a Republican leaning map projected to add roughly five seats to the party's column.
California countered with Proposition 50, a ballot measure approved by voters in a November 2025 special election with 64 percent support, which redrew the state's congressional map to shift an estimated five seats toward Democrats.
Republican officials and the Department of Justice challenged the California map as an unconstitutional racial gerrymander, but the Supreme Court declined to intervene, allowing the new lines to stand for 2026. Missouri, North Carolina, Ohio, Utah, and Virginia also revised their maps mid cycle, though a Virginia court struck down that state's Democratic leaning plan in May.
The net effect has been to raise the floor of seats Republicans can expect to hold and lower the ceiling of Democratic gains, without erasing the national mood implied by the generic ballot. Individual races such as Arizona's 1st District have drawn outsized attention and campaign spending precisely because the seat count is now this tight.
The Senate: A Steeper Climb for Democrats
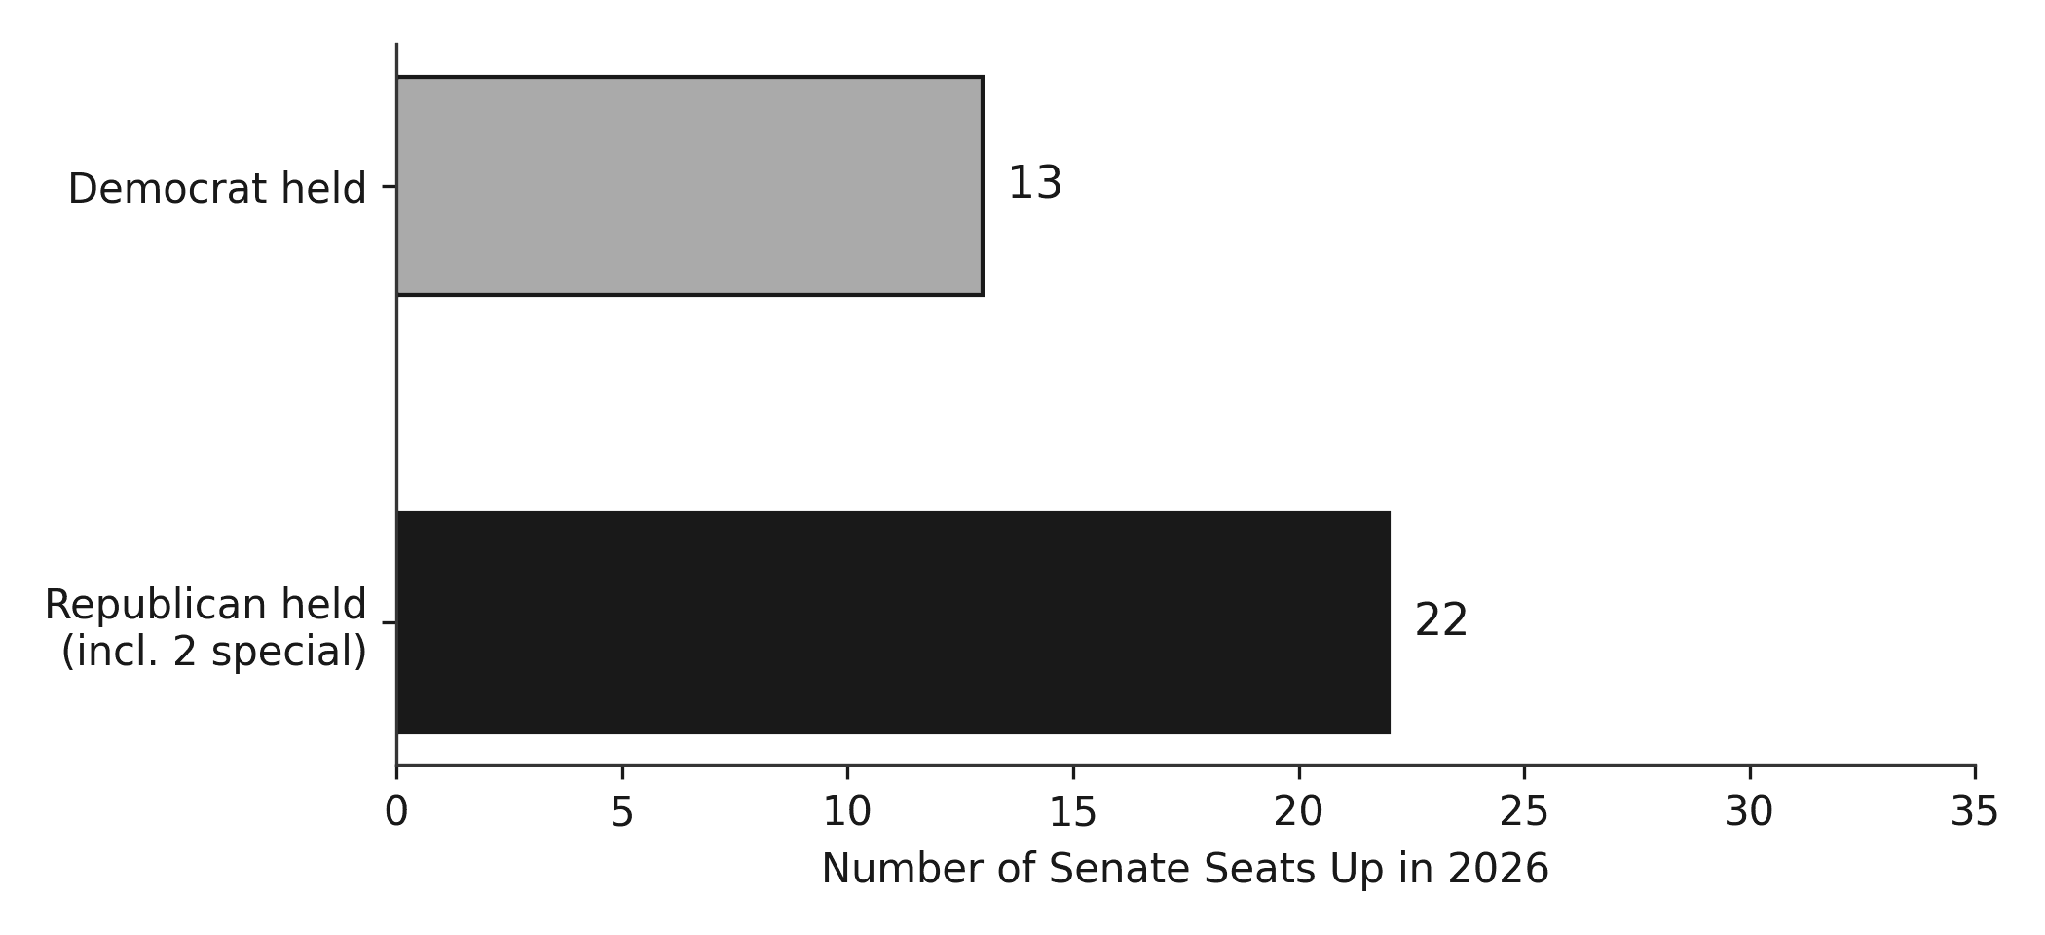
Republicans hold the Senate 53 to 47, counting two independents who caucus with Democrats. Of the 35 seats up this year, 22 are Republican held, including the two special elections in Florida and Ohio, and 13 are Democratic held.
Democrats need a net gain of four seats to reach the 51 required for a majority, a difficult ask given how many of the Republican held seats sit in reliably red states.
Six races are rated as genuine toss ups: Wisconsin, Pennsylvania, Arizona, Georgia, Maine, and North Carolina, where Thom Tillis's retirement has opened a competitive contest.
Democrats are defending two seats in states Donald Trump carried in 2024, Georgia and Michigan, while Republicans are defending one seat in a state Kamala Harris won, Maine. The math still favors Republicans holding the chamber, but a national environment shaped by affordability concerns and healthcare policy has made the map more competitive than its structure alone would suggest.
CHART 02
Senate Seats Up in 2026, by Party Currently Holding Them
What History Says About Markets in a Midterm Year
Midterm years carry a well documented seasonal pattern. Since 1871, the S&P 500 has returned an average of about 3.3% in year two of the presidential cycle, roughly half the long run average across all years, and some of the weakest years on record for the index have fallen in this slot.
The pain tends to be front loaded and the relief back loaded: since 1940, the S&P 500 has risen in the fourth quarter of midterm years about 86% of the time, with an average gain near 6.6%, well above the typical fourth quarter's lower hit rate and smaller average gain.
To help visualize how the stock market tends to behave around midterm elections, explore this interactive historical data tool:
The pattern extends past Election Day itself.
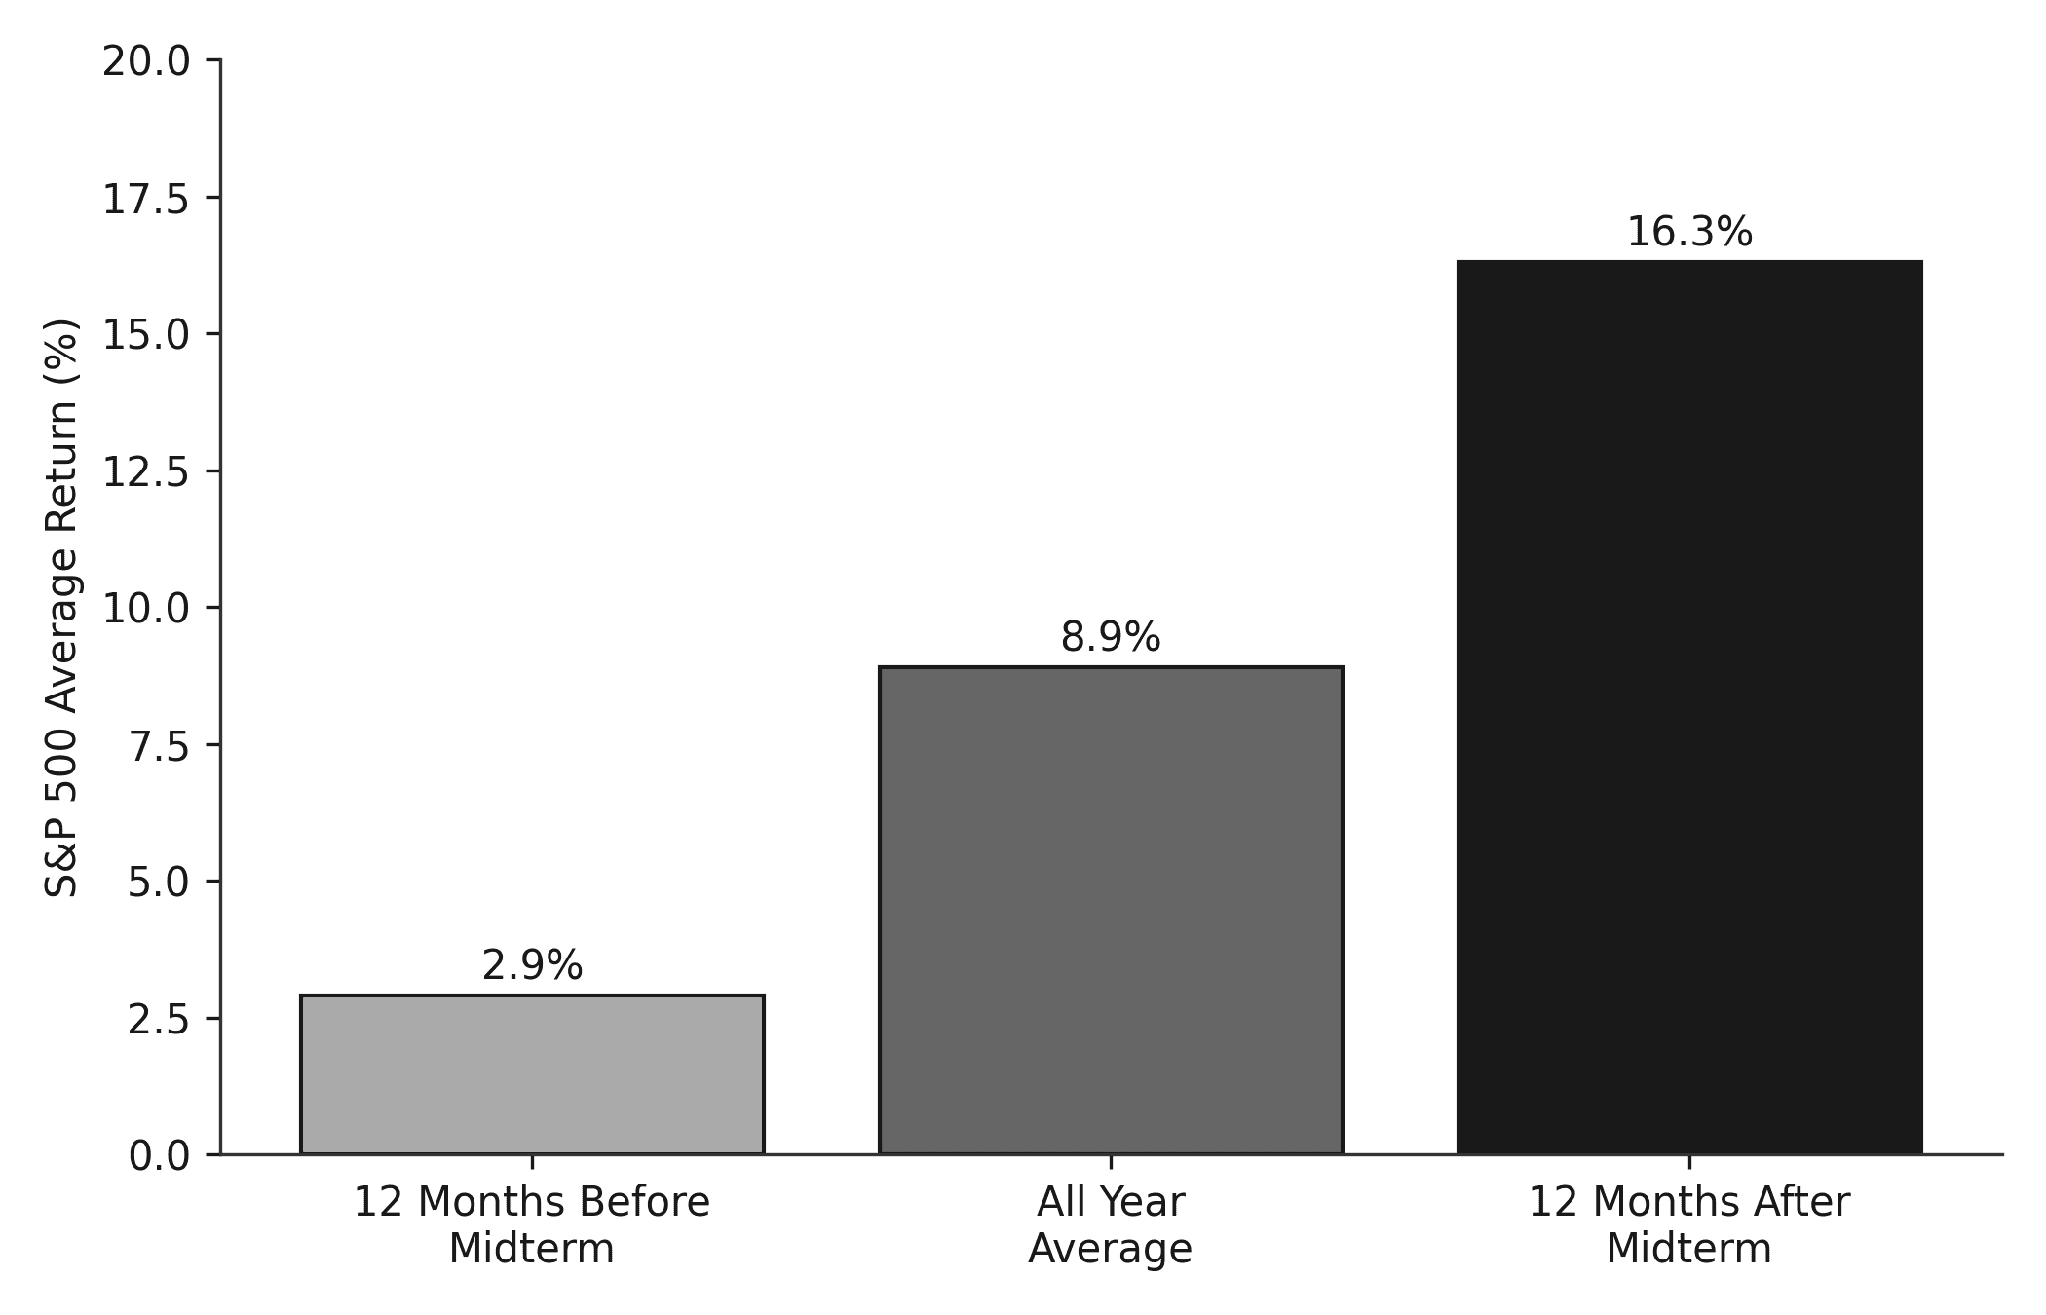
Looking at the twelve months before and after midterm elections over the past six decades, the S&P 500 has historically returned close to 2.9% in the twelve months leading into the vote, below the roughly 8.9% average across all years, before rebounding to an average of around 16.3% in the twelve months that follow, with no negative stretch in that sample.
2018 remains the cautionary counterexample: a midyear rally gave way to a fourth quarter decline of more than 13% as Fed tightening and trade tensions took over the narrative, a reminder that seasonality describes a tendency rather than a guarantee.
CHART 03
S&P 500: 12 Month Return Before and After a Midterm Election
The Policy Lines That Matter for Portfolios
Affordability, healthcare costs, and tariff policy are shaping up as the dominant themes across House and Senate races.
A change in House control would reshuffle committee gavels and could reopen fights over tariff authority, appropriations, and oversight of the administration, all of which carry implications for trade exposed industrials, healthcare payers, and financial names sensitive to the regulatory posture coming out of Washington.
A divided Congress, still the single most probable outcome given the map, tends to produce gridlock on major legislation, which markets have historically tolerated reasonably well, since it lowers the odds of abrupt policy shifts in either direction.
Limits of This Analysis
Generic ballot polling and seat projection models carry real error margins, particularly at the district level where redistricting litigation in states such as Virginia remains unresolved and could still change maps before November.
Prediction market pricing reflects trader sentiment, not certainty. Historical market seasonality is descriptive of past cycles, not predictive of this one, and says nothing about idiosyncratic shocks from monetary policy, earnings, or geopolitics that could dominate returns regardless of the election outcome.

